Key points
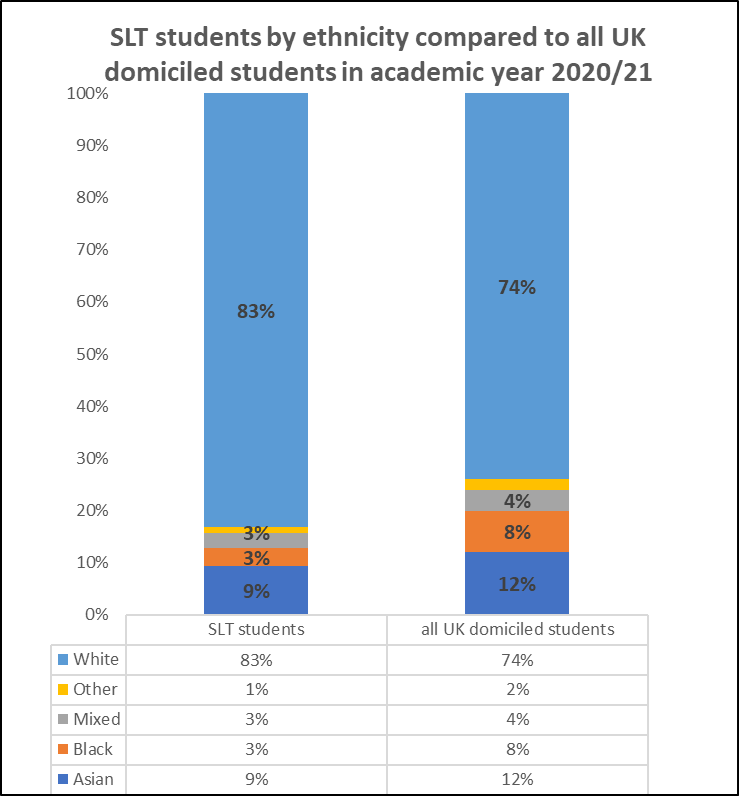
- The speech and language therapy student population is much less ethnically diverse than the student population as a whole.
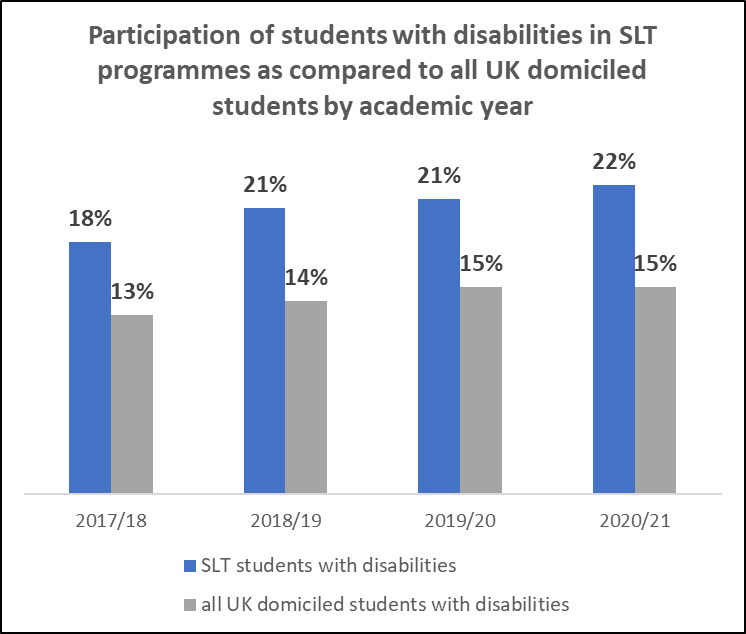
- 22% of the speech and language therapy student population have declared a disability.
The following statistics focus on the make-up of the speech and language therapy (SLT) student population and it’s diversity until the end of the 2020/21 academic year.
In terms of the profession as a whole, HCPC published a diversity report in October 2021, which includes data about speech and language therapists. There is also a factsheet about SLT specifically. We are currently working with our members via our Horizons project to gain more insight on the diversity of the profession.
Overview
- There has been a steady increase in the number of SLT students between 2017 and 2021.
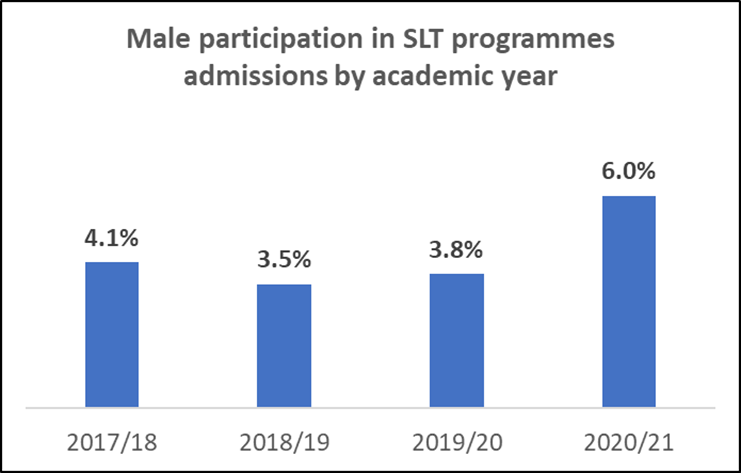
- Female students are overrepresented in SLT programmes.
- There is a greater proportion of white SLT students than in the student population as a whole.
- There has been a significant increase in participation of students from an Asian background across academic years, from 6.1% in 2017/2018 to 9.4% in 2020/2021.
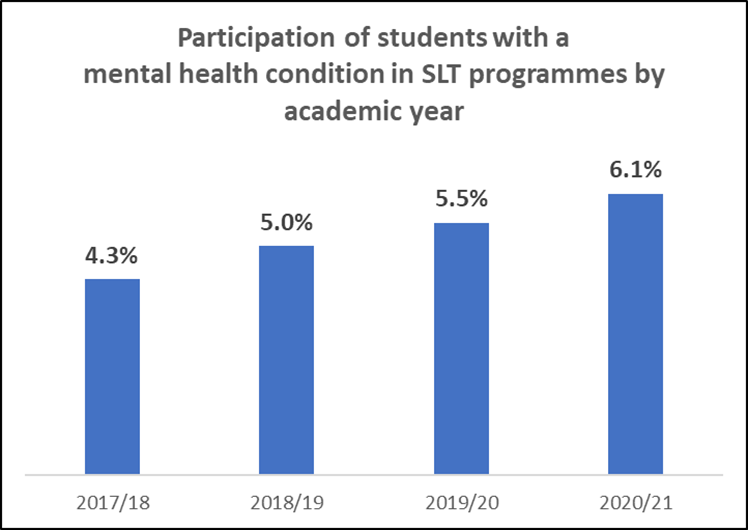
- Students with mental health conditions and specific learning disabilities together account for over a half of students with disabilities.
- 7 in 10 SLT students are from household backgrounds classed as either intermediate occupations or managerial & professional occupations.
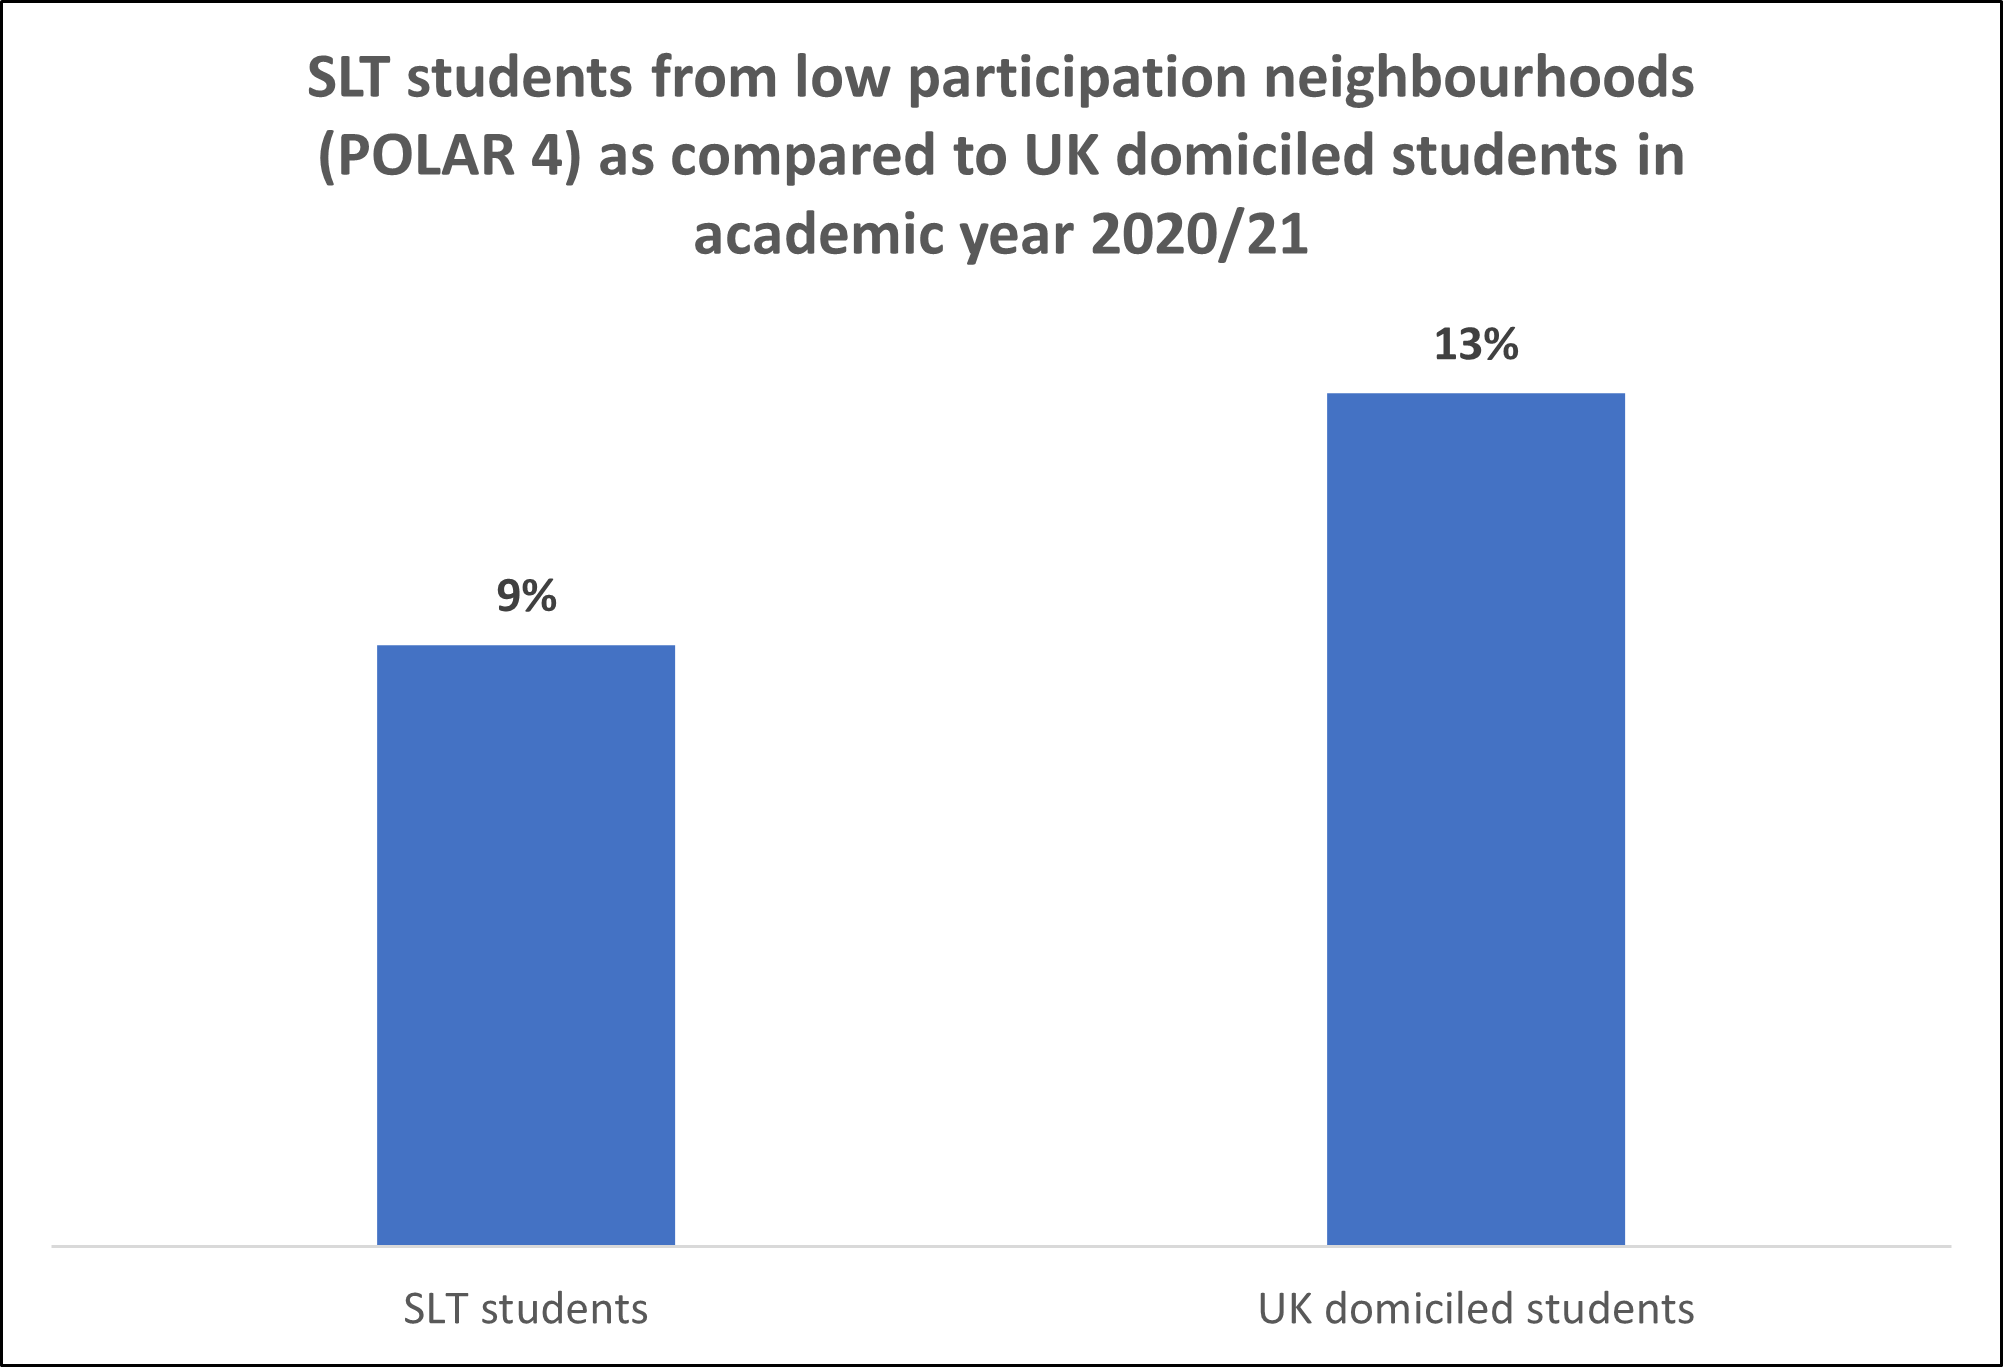
- Students coming from areas where few people attend university are underrepresented amongst SLT students as compared to all UK domiciled students.
Note on statistics:
Statistics originate from the Higher Education Statistics Agency (HESA).
They are provided for the purpose of considering the make-up and diversity of the speech and language therapy profession. All statistics referring to SLT programmes are rounded according to HESA standard rounding methodology. They remain the property of RCSLT and should not be passed on or published without further permission.
You can view details and charts on our findings across the following pages.
Key findings
- A steady increase in the number of SLT students has been observed across years 2017-2021. It closely matches the general increasing trends in the Higher Education student numbers.
- Sharp increases in SLT student admissions were observed in academic years 2018/2019 and 2020/2021. Admissions in those years rose by 17% and 15% respectively.
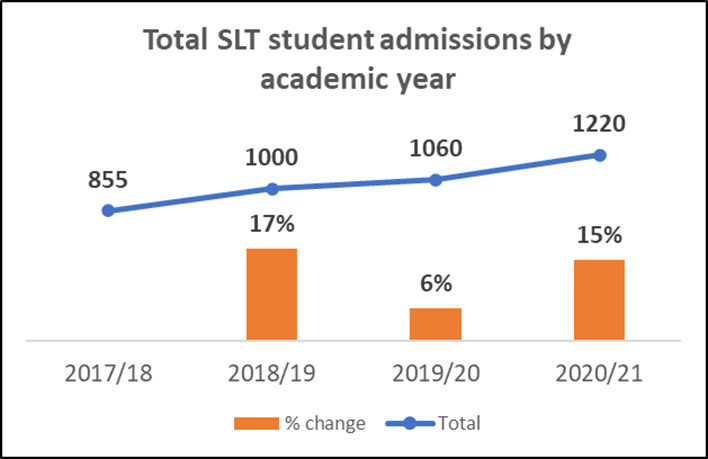
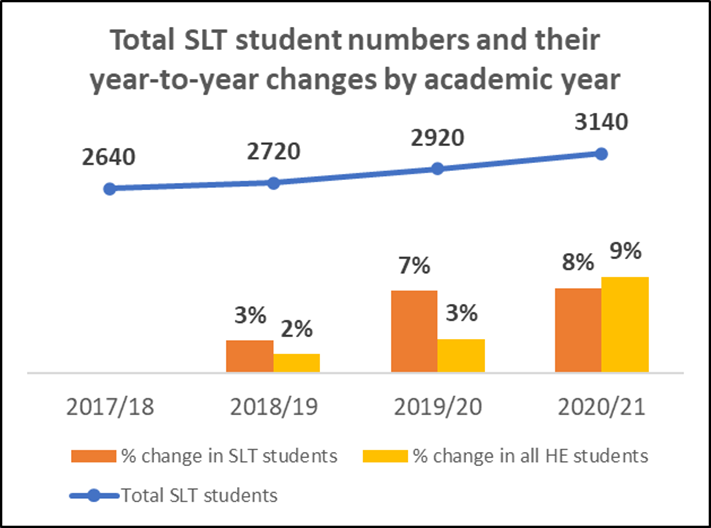
Note: Absolute figures for SLT students have been rounded up according to the HESA standards
Sources
Copyright Higher Education Statistics Agency Limited 2022. Neither the Higher Education Statistics Agency Limited nor HESA Services Limited can accept responsibility for any inferences or conclusions derived by third parties from data or other information supplied by the Higher Education Statistics Agency Limited or HESA Services Limited.
SLT pre-registration student admissions in England 2018-2022
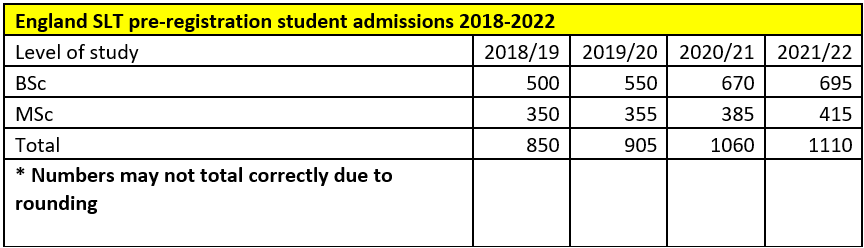
Notes
The source data originates from the Higher Education Statistics Agency (HESA). All statistics and analysis referring to SLT programmes are rounded according to HESA standard rounding methodology. They remain the property of RCSLT and should not be passed on or published without further permission.
Source
Copyright Jisc 2023. Neither Jisc nor Jisc Services Limited can accept responsibility for any inferences or conclusions derived by third parties from data or other information supplied by Jisc or Jisc Services Limited.
Key findings
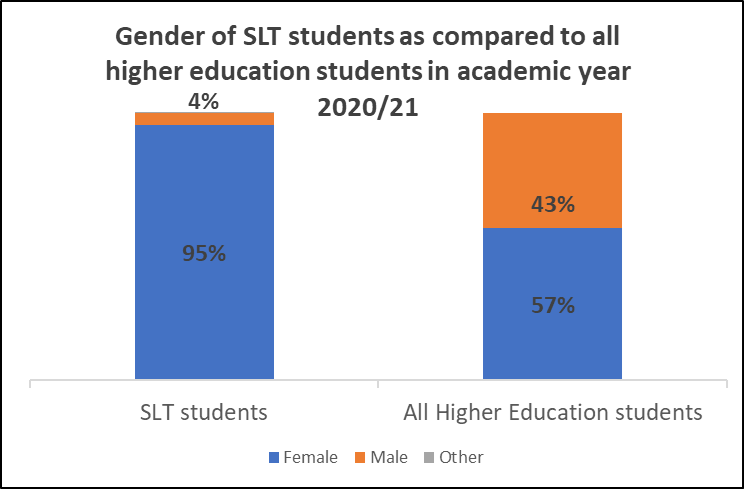
- When referenced against the gender of all higher education students, female students are overrepresented in SLT programmes.
- A significant increase in male participation in admissions to SLT programmes was observed in the academic year 2020/2021.
- These statistics also include people who have not identified as male or female but the number is too small to report in these graphs.
Sources
Copyright Higher Education Statistics Agency Limited 2022. Neither the Higher Education Statistics Agency Limited nor HESA Services Limited can accept responsibility for any inferences or conclusions derived by third parties from data or other information supplied by the Higher Education Statistics Agency Limited or HESA Services Limited.
Key findings
When referenced against all Higher Education students, there is a greater proportion of white SLT students than in the student population as a whole. However, there has been a significant increase in participation of students of Asian background across academic years, from 6.1% in 2017/2018 to 9.4% in 2020/2021.
Sources
Copyright Higher Education Statistics Agency Limited 2022. Neither the Higher Education Statistics Agency Limited nor HESA Services Limited can accept responsibility for any inferences or conclusions derived by third parties from data or other information supplied by the Higher Education Statistics Agency Limited or HESA Services Limited.
Key findings
- A steady increase in participation of disabled students in SLT programmes has been observed between academic years 2017/2018 and 2020/2021. A part of this increase can be attributed to significant increases in SLT students with mental health conditions.
- Students with mental health conditions and specific learning disabilities together account for over a half of students with disabilities.
Sources
Copyright Higher Education Statistics Agency Limited 2022. Neither the Higher Education Statistics Agency Limited nor HESA Services Limited can accept responsibility for any inferences or conclusions derived by third parties from data or other information supplied by the Higher Education Statistics Agency Limited or HESA Services Limited.
Key findings
- 7 in 10 of the SLT students are from households with the backgrounds of intermediate occupations as well as managerial & professional occupations*.
- Students coming from low participation neighborhoods** are underrepresented amongst SLT students as compared to all UK domiciled students.
Definitions:
* Occupation of the parents, stepparents or guardians of students
** The POLAR4 classification is a proxy measurement of how many people go to university from the area a student comes from (not their student address). There are five groups ranging from quintile 1 areas, with the lowest young participation at university (most disadvantaged), up to quintile 5 areas with the highest rates (most advantaged), each representing 20 percent of the UK young student cohort. Low participation(at university) neighbourhoods are defined as quintile 1 in the POLAR 4 classification.
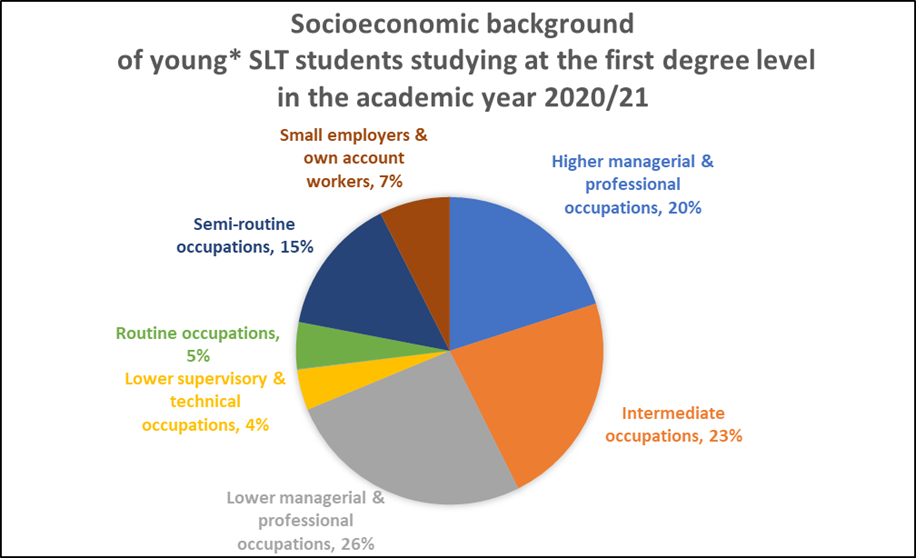
*Note: the classified students are up to 21 years old studying at the first degree level
Sources
Copyright Higher Education Statistics Agency Limited 2022. Neither the Higher Education Statistics Agency Limited nor HESA Services Limited can accept responsibility for any inferences or conclusions derived by third parties from data or other information supplied by the Higher Education Statistics Agency Limited or HESA Services Limited.
Key findings
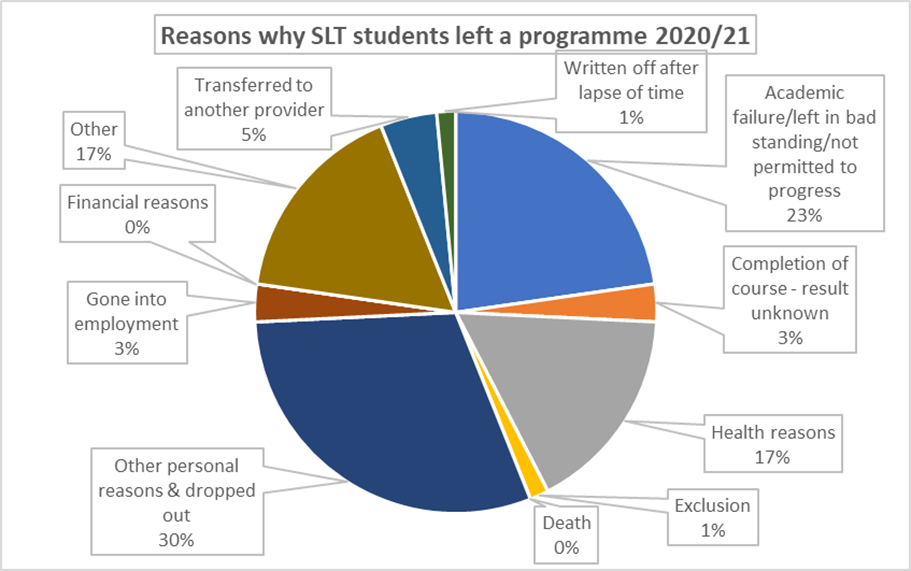
- 70 students left an SLT programme in 2020/21 which accounts for 2% of all SLT students.
- Amongst students who left the program the most prevalent reasons were academic failure, health reasons and other personal reasons. Altogether they accounted for 70% of reasons why students dropped out of an SLT programme.
Note: The numbers of people leaving across years are not high enough to enable statistically robust conclusions about trends.
Sources
Copyright Higher Education Statistics Agency Limited 2022. Neither the Higher Education Statistics Agency Limited nor HESA Services Limited can accept responsibility for any inferences or conclusions derived by third parties from data or other information supplied by the Higher Education Statistics Agency Limited or HESA Services Limited.
- Read about diversity and careers promotion in the spring 2021 issue of Bulletin (PDF)
- Find out about RCSLT projects designed to promote diversity and careers in speech and language therapy
- Download an infographic of the results of our 2020 survey of male SLTs (PDF)
- Read the 2021 HCPC diversity data which provides key EDI information about health and care professions, including speech and language therapy.
